Inflation: Hate to say l told you so

For a while, EV has fielded questions about the inflation forecasts produced by its asset model. Why have they been so high and why have projections of real returns been correspondingly low? Today, these concerns are no longer out of place. In fact, they have not been out of place all along.
But first, some more context. In the latter stages of the pandemic, with the supply chain bottlenecks and increasing economic activity, inflation has moved sharply upwards, much in keeping with what the EV Asset Model has been forecasting for a while.
Hang on, I hear you say, did your asset model predict COVID? In fact, our model has no insight into COVID’s origin or where it came from. So, unsurprisingly, EV’s asset model did not predict the pandemic. However, it has been forecasting that the long-term level of inflation, on balance, was likely to be significantly higher than was being experienced since the global financial crisis in 2008.
Asset Modelling: Myopia vs objectivity
EV’s asset model has a well-established track record which has independently assessed funds using EV’s model for strategic asset allocation. In addition, it is an economic scenario generator, producing thousands of scenarios about how markets may develop and takes a long-term view based on data rather than judgments. Significantly, its forecasts are not based on the input of capital market assumptions (CMAs). More on this later.
With many other asset models, the starting point for producing market forecasts are CMAs that are input into the models by skilled professionals. Clearly, this involves judgments about how the market will develop and, inevitably, these are subjective and incline towards being prejudiced by prevailing market sentiment. Recent history, in particular, tends to have a significant influence on views about the future. Indeed, the low inflation of recent years may have conditioned expectations about future inflation and, by proxy, many models out there.
Instead, EV’s model uses as much data as is available to form a view about long-term trends and how these may be reconciled with prevailing market conditions. This approach avoids giving undue weight to the recent past, which may otherwise have conditioned expectations for very low inflation, or., for that matter, disproportionately overemphasising some other features of the market. It rather focuses on producing an objective view of the market circumstances.
EV’s approach is entirely data-driven, and CMAs are an output of the model rather than an input. The baseline for our real returns is driven by observed real market yields, which have fallen dramatically over the last 25 years.
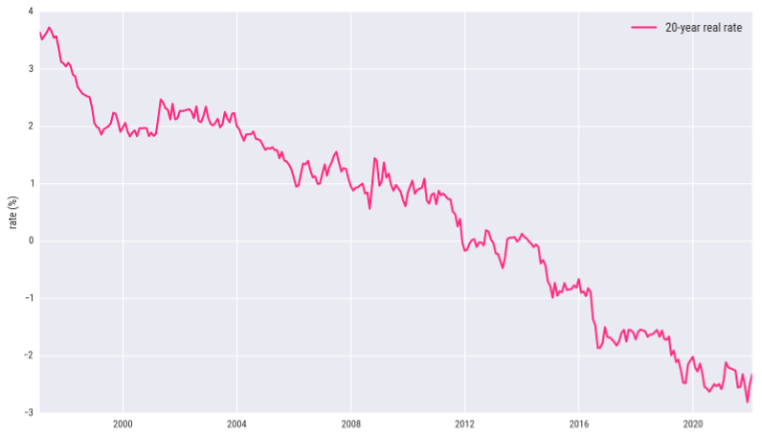
Chart 1 below shows how the 20-year real interest rate has changed over this period.
Chart 1: 20-year real interest rate

Source: EV, as of 31 January 2022
This chart says that, 25 years ago, one could lock in a return of RPI plus nearly 4 per cent for 20 years but, from about 2012, real rates have turned negative and that, for the last few years, investors have been willing to lock in an inflation-adjusted return of –2%! That may appear unfathomable but is a stark reality in today’s markets. In fact, late last year, yields for 10-year UK inflation-linked bonds broke through –3.2% for the first time.
Negative real returns are a reality
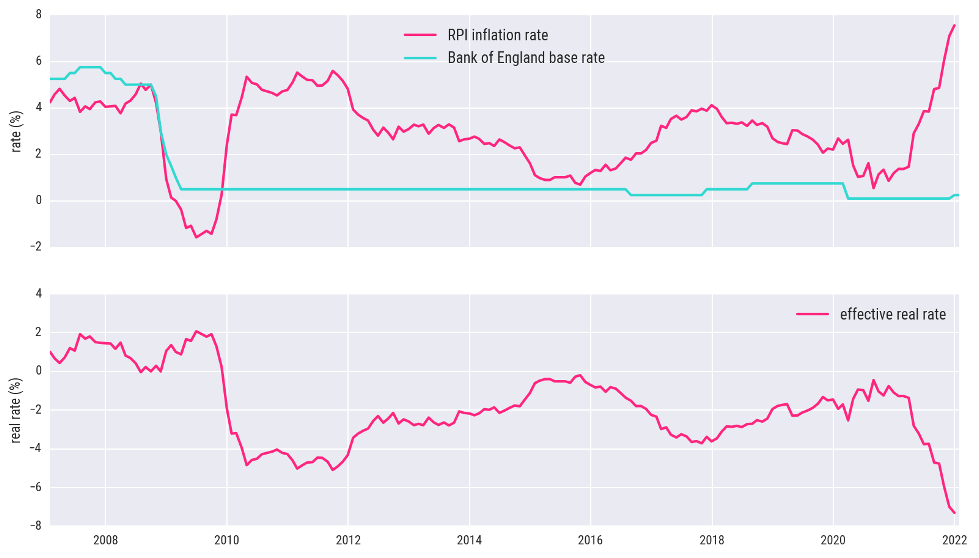
We have been living with negative real returns since a little after the global financial crisis:
Chart 2: Inflation rate and Bank of England base rate

Source: EV, as of 31 January 2022
In Chart 2 above, the upper plot shows the Bank of England’s base rate in green and inflation rate, as measured by RPI over the preceding year, in pink. The effective real rate, which is the spread between these and shown in the lower plot, has been negative for more than a decade.
Low real returns can come from low absolute returns or high inflation.
Inflation has been coming
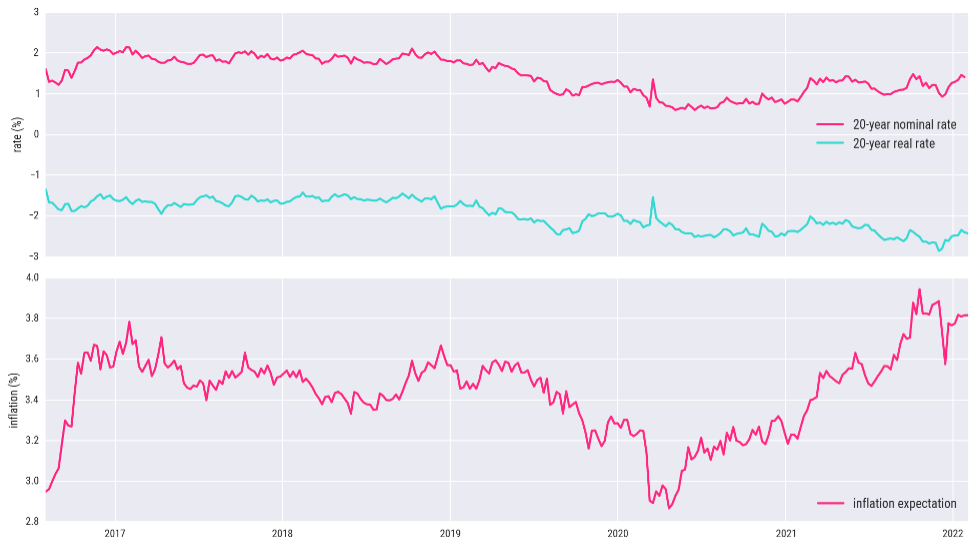
The breakeven inflation rate is commonly referenced as an inflation indicator:
Chart 3: Breakeven inflation expectation

Source: EV, as of 31 January 2022
The upper plot in Chart 3 above shows the movement of 20-year ordinary (or nominal) and real (minus inflation) interest rates over the recent past. The difference between these, shown in the lower plot, is a rough indication of expected inflation over the next 20 years. These market observations contribute to the higher average inflation forecasts produced by EV’s asset model.
Inflation today
Inflation is now the big story in markets. It was inevitable that we would not see the full extent of the damage done to the economy by the pandemic until an attempt was made to restart it. From semiconductor shortages to the fleets of ships anchored off the coast of California waiting to unload their cargo, it’s clear that circulation is still not back to normal.
Inflation has reached 7% in the US, even the EU has pushed over 5%, and the UK has surpassed the 7% level that markets were pricing in not long ago. Inflation is certainly here. The question is how long it’s going to stay. It’s reasonable to expect that a lot of the inflation might be a one-off adjustment that the markets and policymakers should "look through". However, the breadth and variety of adjustments involved make that picture less clear, and we are left trying to answer how much of this effect is temporary and when will things return to “normal”? It’s patently something many central bankers are now worried about and hawkish tones from a lot of them certainly seem to be gathering pace.
Where does inflation go from here?
So, what is the EV asset model saying about future expectations for inflation? As alluded to above, the model doesn’t produce just one view of the future but a whole range of possibilities. Ten thousand different scenarios describe a probability distribution of outcomes, with bunching up around the more likely ones. As events unfold and markets change, this probability distribution will change and, with that, implications for inflation, the relative returns on different asset classes and our optimised risk-targeted asset allocations.
As far as the inflation outlook is concerned, there are no signs that we are returning to the levels seen in the 1970s. There is little change in the model’s longer-term outlook for inflation. After the current spike in inflation, the long-term outlook is for inflation to return more or less to the levels that the model was predicting before the pandemic. So, while our model forecast higher inflation levels than was generally experienced before the pandemic, the current spike is expected to be just that - relatively short-term.
As the future unfolds, the model’s forecasts change with it and a different economic situation may become more probable. Having 10,000 scenarios to choose from and updating them every quarter helps if you want to be right. But, maybe that’s not so clever.
So what next?
Have you been looking for innovative ways of enhancing your in-house research capabilities? If so, it would be great to have the opportunity to talk you through the new EV Asset Allocation Research.
The quarterly research pack offers a range of financial market insights, including:
- Reliable, independent oversight and model-driven Capital Market Assumptions (CMAs)
- Forecasts for a broad range of economic indicators and investment markets
- High-level, risk-targeted Strategic Asset Allocations (SAAs)
- Unique market perspectives, commentary and insights
Book a discovery call with one of our experts to find out more.
.png?width=645&name=EV%20Quarterly%20Asset%20Allocation%20Research%20(1).png)