In our recent blog, we asked the question Why Should Sequencing Risk Matter to Your Drawdown Customers?
However, it is also important to help your customers understand other risks that will impact their prospects in retirement. This will make the difference between your customer being able to leave a legacy and running out of money in retirement. In addition to sequencing risk, a retiree using drawdown as a source of income is also vulnerable to high levels of market volatility.
How to best communicate market volatility to your clients?
The way to communicate the impact of volatility - or any investment risk for that matter - is to provide simple, online tools to help educate your customers. That way, they can easily understand the different scenarios that might play out - especially in the latter stages of accumulation and early stages of decumulation - with the reactive changes they may need to implement in order to keep their retirement plans on track. But being able to explain the concepts in simple terminology is equally important.
Pound Cost Averaging
During your customer’s working life, periods of volatility can be used to benefit a customer’s investment returns - but only if managed correctly. A good way to smooth out the impact of volatility on their returns is to make regular contributions to their investment or pension fund during the ‘accumulation of wealth’ stage of their financial life cycle. This approach is known as ‘pound cost averaging.
By encouraging your customers to make regular contributions to their investment funds, they will buy fewer units when prices are higher, and more units when prices are lower. This also helps to dampen any worries around making lump sum investments at the wrong time. As we know, timing the market is pretty much impossible, unless you have a crystal ball or are extremely lucky.
This approach can take advantage of volatile periods and potentially improve long-term investment returns, as the higher the level of volatility, the more advantageous the effect.
However, as your customer enters the ‘decumulation’ phase of their financial life-cycle, the effect is the exact opposite.
Pound Cost Ravaging
A retiree drawing a regular income from his or her investments is vulnerable to high market volatility – the higher the volatility the worse the effect. This impact is often referred to as “pound cost ravaging”. High price volatility reduces the level of sustainable income that can be afforded. The higher the volatility, the worse the effect.
For customers drawing an income from their pension in retirement, pound cost ravaging is a risk that is often misunderstood - and often ignored. If managed incorrectly, your customer’s pension pot will be used up faster than expected, which could lead to them running out of money.
The different impacts of market volatility on funds
The following example illustrates the pound cost ravaging effect in action.
Consider a steady return of 5% p.a, with fluctuations of 10% upwards and downwards. For withdrawals of £500 a year from a £10,000 fund, it might be expected that the steady 5% p.a. a return would be sustainable - i.e. it would not erode capital.
Figures 1a and 1b show this is not the case.
Figure 1a: Initially positive variation (All units in £)
| Year | 1 | 2 | 3 | 4 | 5 | 6 | 7 | 8 | 9 | 10 | 11 | 12 |
| Return | 15% | -5% | 15% | -5% | 15% | -5% | 15% | -5% | 15% | -5% | 15% | -5% |
| Fund size after return | 11,500 | 10,450 | 11,443 | 10,395 | 11,380 | 10,336 | 11,311 | 10,270 | 11,236 | 10,199 | 11,154 | 10,121 |
| Income | 500 | 500 | 500 | 500 | 500 | 500 | 500 | 500 | 500 | 500 | 500 | 500 |
| Fund size after Income | 11,000 | 9,950 | 10,943 | 9,895 | 10,880 | 9,836 | 10,811 | 9,770 | 10,736 | 9,699 | 10,654 | 9,621 |
Figure 1b: Initially negative variation (All units in £)
| Year | 1 | 2 | 3 | 4 | 5 | 6 | 7 | 8 | 9 | 10 | 11 | 12 |
| Return | -5% | 15% | -5% | 15% | -5% | 15% | -5% | 15% | -5% | 15% | -5% | 15% |
| Fund size after return | 9,500 | 10,350 | 9,358 | 10,186 | 9,202 | 10,007 | 9,032 | 9,811 | 8,846 | 9,598 | 8,643 | 9,364 |
|
Income |
500 | 500 | 500 | 500 | 500 | 500 | 500 | 500 | 500 | 500 | 500 | 500 |
| Fund size after Income | 9,000 | 9,850 | 8,858 | 9,686 | 8,702 | 9,507 | 8,532 | 9,311 | 8,346 | 9,098 | 8,143 | 8,864 |
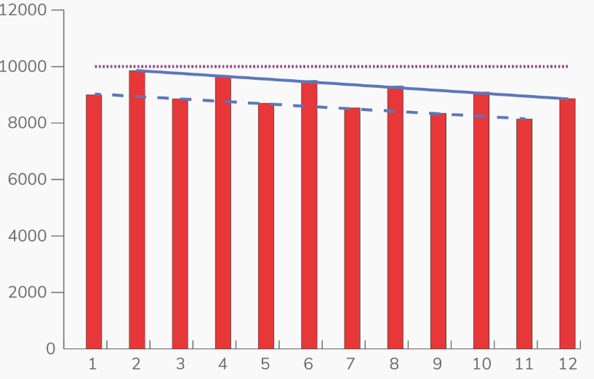
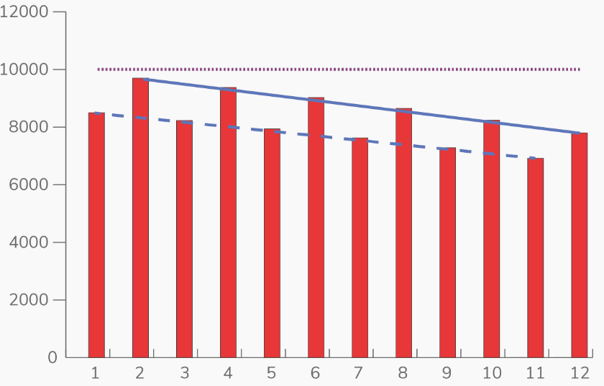
Figures 2a and 2b show the effect more dramatically:
Figure 2a: 10% Initially Positive
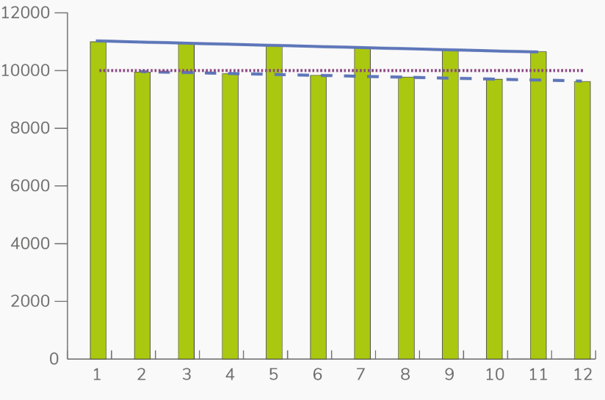
Figure 2b: 10% Initially Negative
If the volatility is increased from 10% to 15%, the erosion of capital is even more pronounced (as shown in Figures 3a and 3b):
Figure 3a: 15% Initially Positive
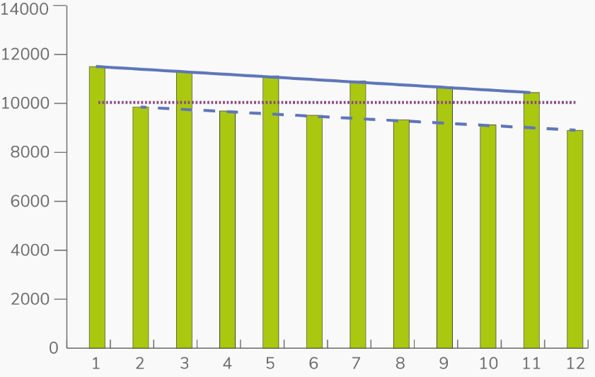
Figure 3b: 15% Initially Negative
So what next?
The importance of giving due consideration to the impact of volatility when setting a drawdown strategy cannot be overstated. To find out how stochastic forecasting can help provide more realistic projections, download our eBook on Modelling future outcomes: Why stochastic is the credible choice?