
EV Investment Solutions are grounded in robust and academically-tested investment beliefs that deliver performance by design.
Over a 10 year live track record, and with £10 billion managed according to our asset allocations, our portfolios and asset allocations have consistently outperformed the market. In the face of some of the most challenging market disruptions ever our portfolios have yet again outperformed the market because of superior forecasting capability and asset allocation methodology.
The role of our asset allocations is to enable investors to
- get best risk-adjusted returns
- retain focus on long term goals
- make the most of the opportunities available through diversification
In the face of an unprecedented crisis that has already seen state intervention surpass the Global Financial Crisis and record market movements, it is the first two that are most important. Our allocations are based on a model that has allowed for moves of this magnitude (see Charts 1-6 below) and has provided protection to those that sought it (see Charts 8-10 below).
The outcome of the crisis remains highly uncertain and our model does not make detailed forecasts of the still emerging biology of the COVID-19 virus or the various human responses. Instead, it forms a balanced view based on aggregating market knowledge and considers the impact over useful timescales. This approach will not necessarily take investors out of the market at the top and bring them back in at the bottom but it will avoid the more frequent pattern of doing the opposite through panic. This crisis is of unprecedented and still unfolding scale but this approach was tested in the 2008 crisis and our asset allocations navigated that and subsequent panics with great success.
Market Events
The recent events have been nothing short of a global market crash, attributed by most to the COVID-19 outbreak but had been on the cards for a while as the market had been heating up on the back of one of the longest bull-runs in history and so was in for some sort of correction. Markets were already wary when yield curve inversion began to appear last year. Global growth estimates had been subdued for the past few quarters and with several downward revisions to forecasts, the sharp blow to productivity dealt by the coronavirus pandemic together with some disagreements over oil production were enough to push things over the edge.
What followed has been one of the most dramatic events in history to hit capital markets. In some ways, it is more extreme than any seen before owing to the short timescales. Central banks have flooded the markets with unlimited monetary stimulus and many governments have further responded with fiscal measures but these have still had relatively limited impact on alleviating concerns and markets have vacillated violently between opposite extremes. The VIX, for instance, was trading at record highs for a while over this period. We’ve seen the biggest single day fall since the 1987 crash and also the largest one-day gain since the Great Depression.
Amidst the chaos, there have been several “anomalous” market movements too: many bond funds actually lost money as interest rates cratered while the atypical co-movement of bonds and equities in the middle of the turmoil points to market fragility that is still not quite understood.
All these are features of severe market dislocation and, with sentiments running high, it takes a data-driven model only like EV’s to take an objective view and make sense of the chaos.
Superior modelling delivers superior returns
While the events of the past few weeks have been extreme, the scenario is one considered in our portfolio optimization process (see Charts 1-6 below). Our accurate treatment of term structure has meant that short- and long-term portfolios have also performed predictably (compare Charts 9 & 10).
The EV asset model allows for large market swings and the events of March lie comfortably within our monthly range (see Table 1).
Table 1: Global market change (%) in total returns for the month of March 2020
| Currency | FTSE100 | S&P 500 | EuroSTOXX 60 | TOPIX | MXEF | MXAPJ |
| Local | -13.43 | -12.35 | -16.18 | -6.10 | -15.41 | -14.01 |
| GBP | -13.43 | -9.78 | -13.96 | -3.01 | -12.93 | -11.49 |
Source: EV Index Solutions as at 31 March 2020. Past performance is not a guide a future returns.
The movement in the FTSE 100 over the month of March has a probability of about 0.74% in our model, or once every 11-12 years or so, which is a view with clear support in empirical evidence. Over an extended period, the model allows for even larger declines, or gains for that matter. So while March has been record-breaking, and there is great and genuine uncertainty, this reality is accounted for in our model and breaks other simpler models.
Our asset allocations are driven directly by model returns which in turn have an explicit dependence on prevailing market circumstances. Short term risk does not have much impact on risk measures used in our allocations but valuations do.
Charts 1-6 below show how the EV asset model captured interest rate and equity behaviour in the Global Financial Crisis of 2008 as well as the recent market tumult with great efficacy, both in historical and latest projections:
Chart 1: UK interest rate projections (historical)
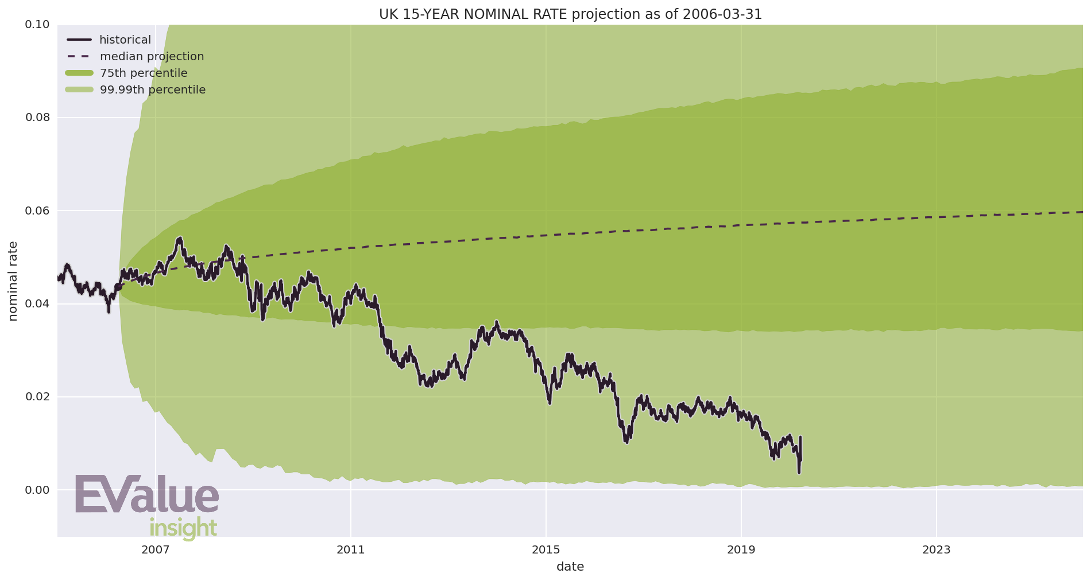
Source: EV Index Solutions as at 31 March 2020.
Chart 2: UK interest rate projections (latest)
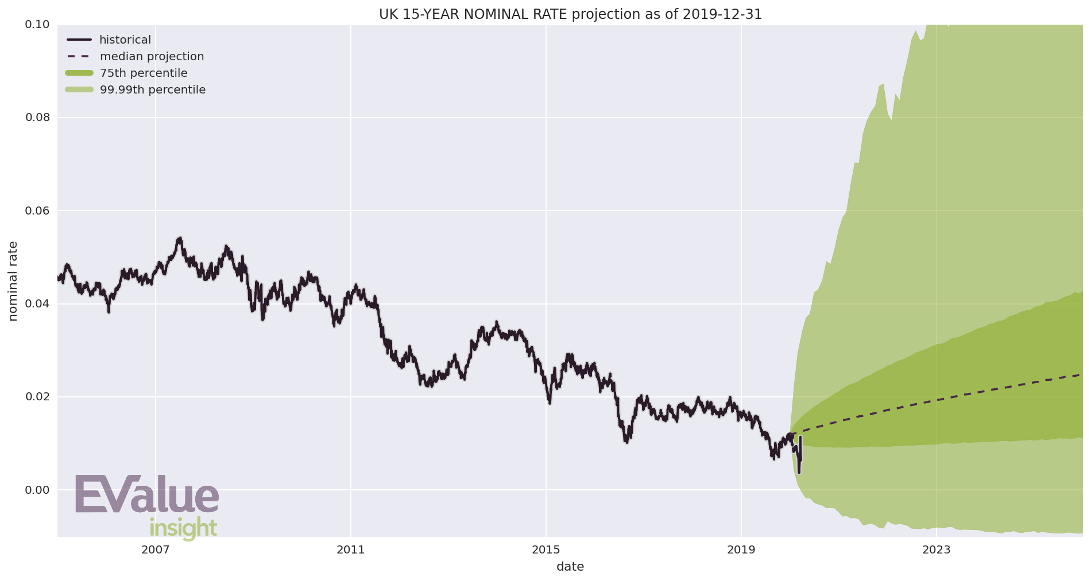
Source: EV Index Solutions as at 31 March 2020.
Chart 3: UK equity projections (historical)
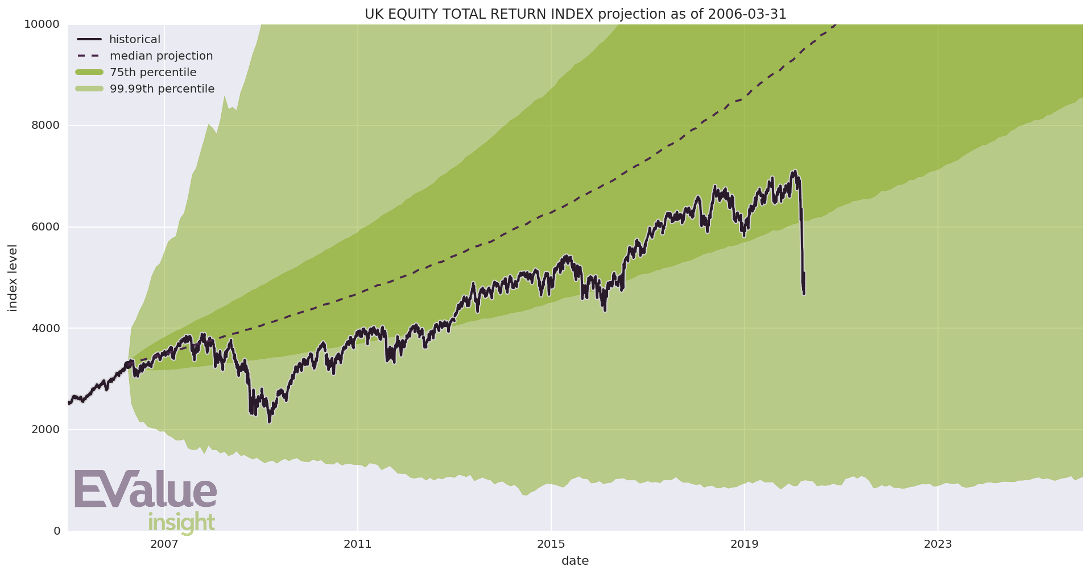
Source: EV Index Solutions as at 31 March 2020. Past performance is not a guide a future returns.
Chart 4: UK equity projections (latest)
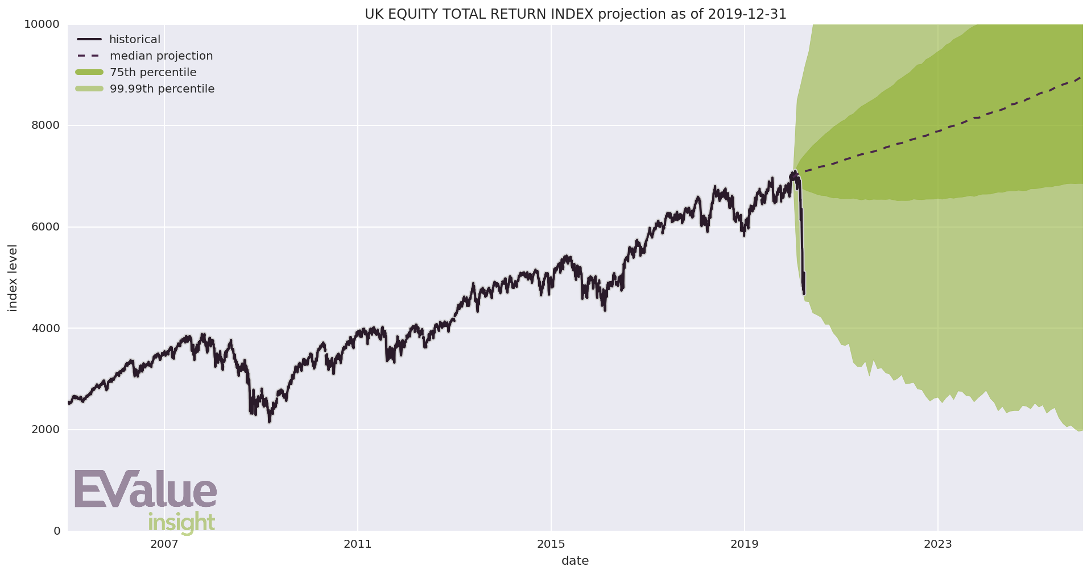
Source: EV Index Solutions as at 31 March 2020. Past performance is not a guide a future returns.
EV's model is global and the disorder in US interest rate and equity, for instance, has also been captured similarly well:
Chart 5: US interest rates
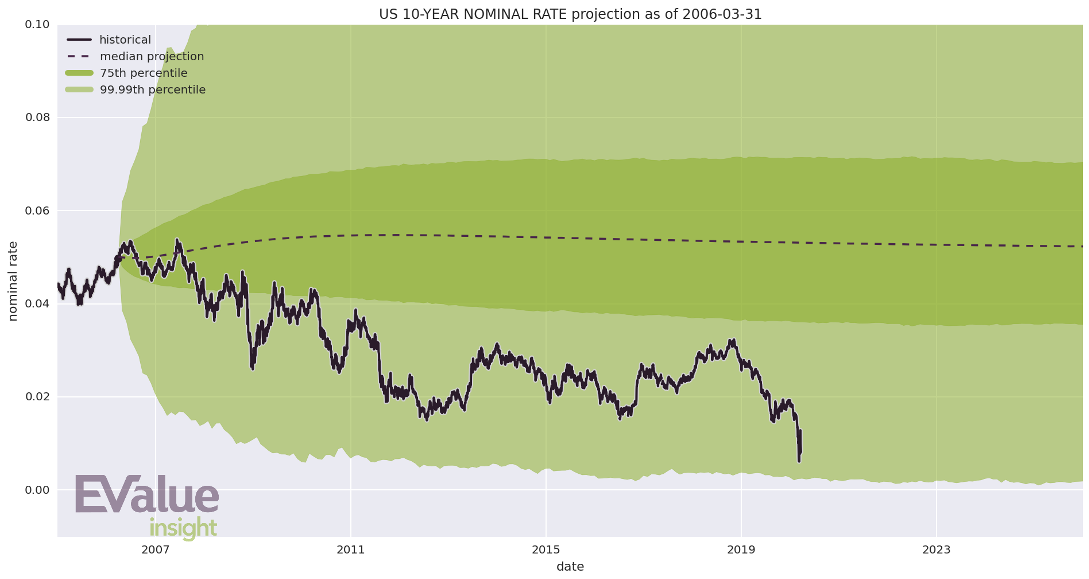
Source: EV Index Solutions as at 31 March 2020.
Chart 6: US equities
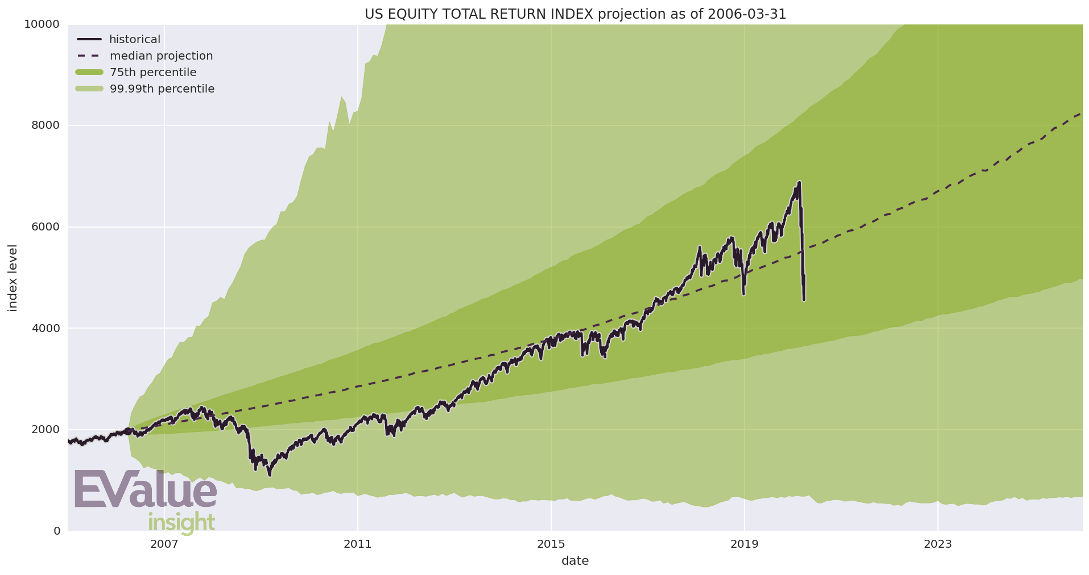
Source: EV Index Solutions as at 31 March 2020. Past performance is not a guide a future returns.
Resilient Portfolios
Recent market volatility has been dominated by equity markets which have seen some very remarkable falls. Depending on when a snapshot is taken, the market picture can be quite different (compare Tables 1, 2 and 3). This also lends support to avoiding investor panic.
In local currency terms, the main blue-chip total returns indices have performed thus (see Table 2):
Table 2: Equity market indices in local currency
| FTSE 100 | S&P 500 | EuroSTOXX 60 | TOPIX | MXEF | MXAPJ | |
| 31/12/2019 | 6980.94 | 6553.57 | 7949.64 | 2625.91 | 529.33 | 530.40 |
| 25/03/2020 | 5325.54 | 5045.35 | 5959.44 | 2174.58 | 397.02 | 409.44 |
| Change | -23.71% | -23.01% | -25.04% | -17.19% | -25.00% | -22.81% |
Source: EV Index Solutions as at 31 March 2020. Past performance is not a guide a future returns.
However, currency movements have also been all over the place during this market disruption so the table above looks very different in GBP terms, say (see Table 3):
Table 3: Equity market indices in GBP
| GBP | FTSE 100 | S&P 500 | EuroSTOXX 60 | TOPIX | MXEF | MXAPJ |
| 31/12/2019 | 6980.94 | 4943.36 | 6723.19 | 18.24 | 399.28 | 400.08 |
| 25/03/2020 | 5325.54 | 4246.67 | 5458.77 | 16.46 | 334.17 | 344.63 |
| Change | -23.71% | -14.09% | -18.81% | -9.75% | -16.31% | -13.86% |
Source: EV Index Solutions as at 31 March 2020. Past performance is not a guide a future returns.
Yet, EV portfolios have demonstrated exceptional resilience in the face of these extreme conditions, and have outperformed the market. The strength of the EV asset model and its market-leading forecasting capability is enabled by the data-driven approach that underlies it. As a global model, it accounts for, inter alia, relative valuations as well as currency effects, and so together with a robust asset allocation methodology, produces portfolios that have weathered the storm much better than most. The accurate treatment of term structure means short- and long-term risk are captured well and produce predictable results (compare Charts 9 & 10).
EV Standard portfolios - increased allocation to Govt Bonds and Japan Equities drove performance
EV Standard is our unconstrained class of portfolios. These long-only portfolios are derived with no other constraints applied except for volatility bounds to match various risk appetites. They have previously read the market correctly in the lead up to various crises, such as the Global Financial Crisis and the run up to the Brexit referendum, and have done so again this time around (see Charts 7 & 8):
Chart 7: EV Standard asset allocation history for mid-risk portfolio
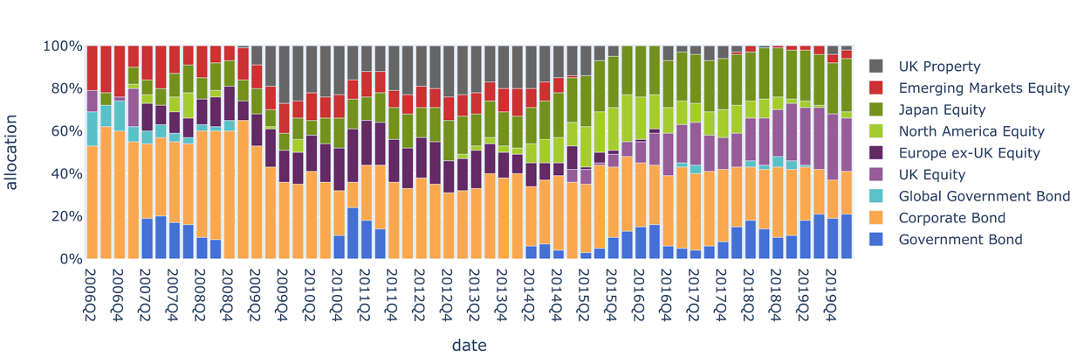
Source: EV Index Solutions as at 31 March 2020.
Over the last few quarters, our allocation to corporate bonds has been reducing in favour of government bonds. Likewise, exposure to UK equity has been increasing in lieu of US equity. We have also been overweight Japan equities and that has paid off as Topix fell by only 10% - the least of all equity markets in the world (see Tables 1 and 3).
The model’s outlook on Property has become increasingly bearish and is reflected in the diminished allocation. These allocations have braced our EV Standard portfolios very well in the face of recent market upheaval (see Chart 8).
Chart 8: EV Standard portfolio performance
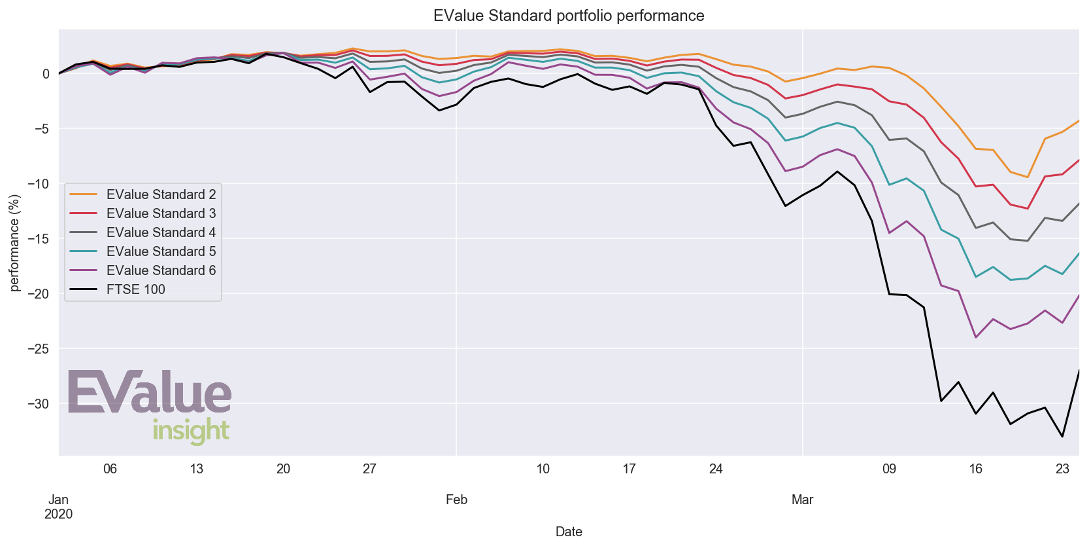
Source: EV Index Solutions as at 31 March 2020. Past performance is not a guide a future returns.
EV model portfolios
EV model portfolios differ from our Standard ones in that developed market equities are considered together and allocation to Property is constrained to reflect its illiquid nature. Like EV Standard, these portfolios have also demonstrated remarkable resilience against the severe market dislocation.
Higher risk portfolios have, as expected, responded more directly to the recent market volatility but still much less acutely than the market (see Chart 9):
Chart 9: EV long horizon model portfolio performance
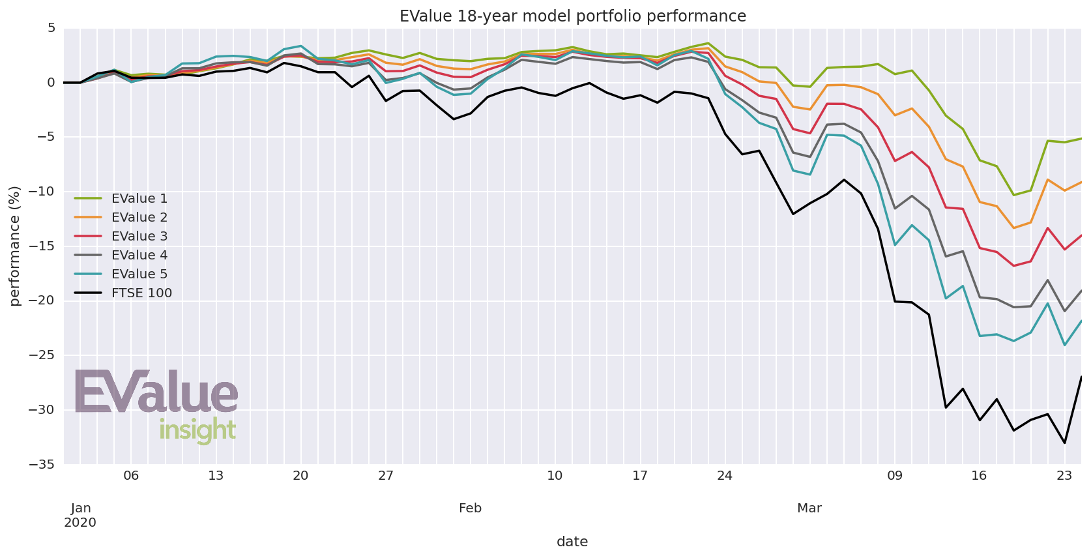
Source: EV Index Solutions as at 31 March 2020. Past performance is not a guide a future returns.
While shorter investment horizon portfolios have been relatively more insulated from the turbulence than longer term ones, again as designed (see Chart 10):
Chart 10: EV short horizon model portfolio performance
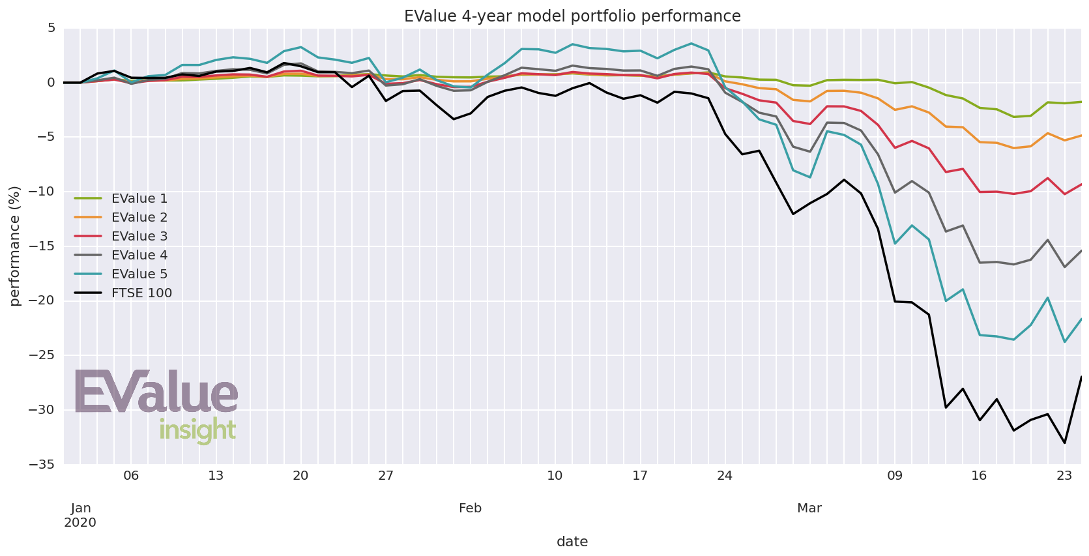
Source: EV Index Solutions as at 31 March 2020. Past performance is not a guide a future returns.
Excellent long term performance
Our robust asset allocation methodology is founded on our key investment belief that small relative value-driven allocations yield consistently excellent performance and deliver outstanding long term results. So while our portfolios demonstrated exceptional resilience in the wake of the current crisis, they have also consistently produced excellent long term market-beating performance in the bull market preceding it (see Charts 11 & 12).
Source: EV Index Solutions as at 31 March 2020. Past performance is not a guide a future returns.
Chart 11: Long term performance of EV Standard portfolio
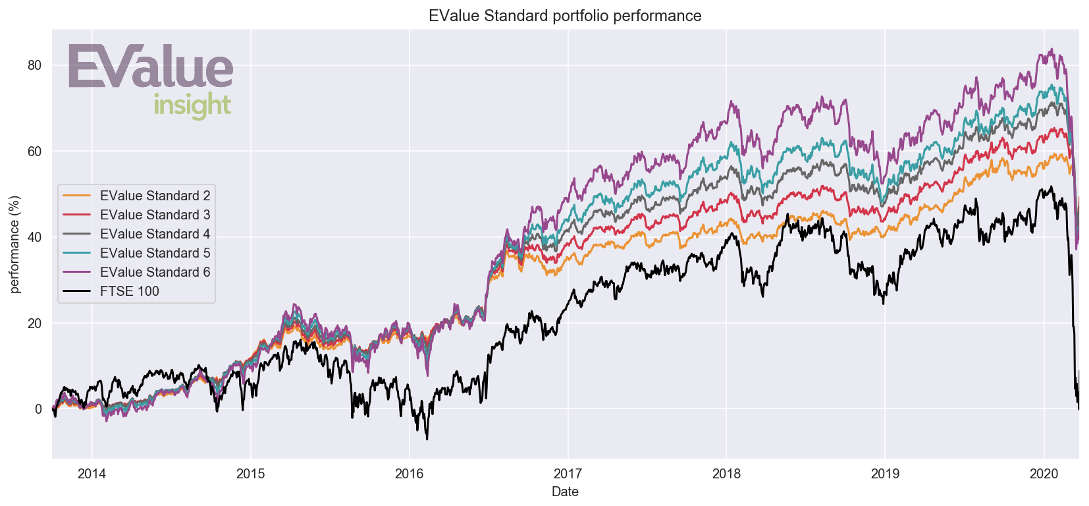
Source: EV Index Solutions as at 31 March 2020. Past performance is not a guide a future returns.
Chart 12: Long term performance of mid-risk EV model portfolios
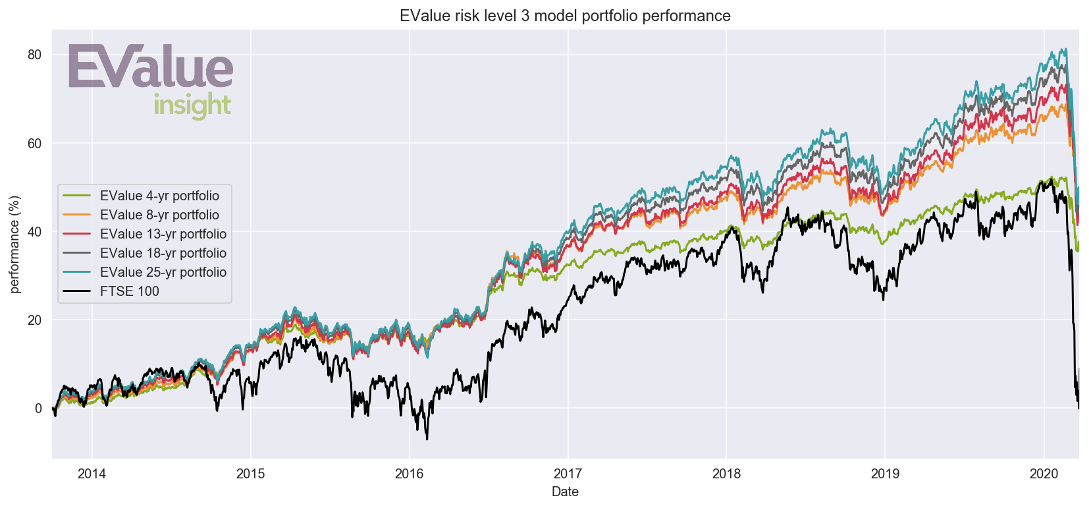
Source: EV Index Solutions as at 31 March 2020. Past performance is not a guide a future returns.
Conclusion
Our model has outperformed the market and other funds consistently for over a decade. This outperformance and resilience was especially visible during the Global Financial Crisis and during the current crisis. We believe that this is a strong validation of our model and track record.
We are constantly monitoring the situation and will be publishing model updates every quarter as usual. Markets remain unsettled so we may also release intermediate updates if they become necessary. Currently, our next model update is the quarterly one due for April 2021.
Visit www.ev.uk to continue your journey with us.