There’s no question that the advice profession has its work cut out to provide financial planning that will keep client suitability at the centre of everything for years to come. Risk mapping is a critical component of this – yet it’s a pathway littered with pitfalls waiting for the unwary around every corner. So let’s look at how risk profiling methodology has evolved and how to sidestep the hazards that can trip up the best intentions.
In recent times, risk profiling methodology has moved on to accommodate objective-based outcomes and enable easier implementation within the advice journey. However, what’s vital in 2022 and beyond is being geared up to pinpoint which fund will provide a sustainable income level and navigate market volatility at your client’s acceptable level of risk.
Enter risk mapping – the methodology underpinning investment risk suitability from start to finish.
Risk mapping challenges aplenty
Different risk definitions, inconsistent scoring, objective matching, and investment terms are used in other areas of the investment proposition. These common challenges will only grow as the business scales. Problems can become entrenched as firms adopt PROD and move into micro-segmentation of their client bank.
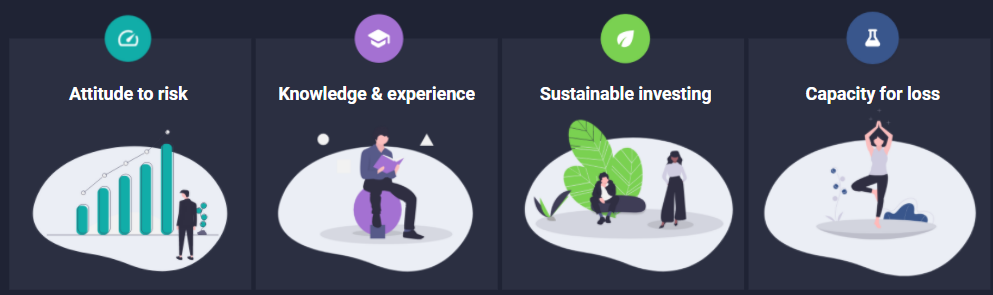
The ultimate goal of risk mapping is clear: to ensure the suitability of an investment against the client’s risk profile. But there are four core areas within the advice journey where risk can be expressed, defined and forecasted differently, resulting in the potential for misalignment.
The danger is that if the risk questionnaire, the suggested asset allocation benchmarks, the risk mapping, and the portfolio/proposition are all applying different methodologies, there’s a chance that we can’t ensure suitability and create an advice journey that’s clear and easily understood. But, of course, no one wants that, so let’s take stock of these four areas in more detail, focusing on the main pitfalls and pesky opportunities for misalignment.
Read our accompanying blog for more information; Avoiding risk misalignment in client portfolios.
Attitude to risk questionnaire hazards
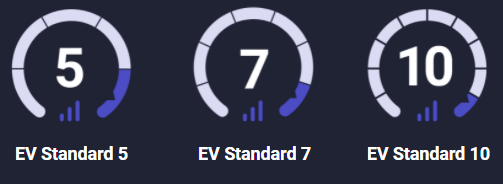
From a client’s perspective, the risk is examined and defined at the start of the advice journey, often represented on a simple numerical scale, e.g. 5/7/10. The attitude to risk questionnaire (ATRQ) establishes a client's risks and lays the foundations for discussions around an individual’s willingness to take investment risk. So, this is often the first instance when risk is discussed, interpreted and given a score.
Using an independent and statistically verified ATRQ helps create a robust process. On the other hand, the possible pitfall of doing this in-house brings the potential for kick-out questions, against which complaints have previously been upheld.
Measuring attitude to risk is to identify the individual’s underlying attitude, thus enabling the financial adviser to provide an appropriate investment. However, the client’s attitude to risk is only one factor determining a suitable investment. Ascertaining their capacity for risk, ESG preferences, financial goals, level of capital and income requirements are also essentials.
The psychometric scoring methodology that underpins an ATRQ can make a big difference to a client’s risk profile and the level of risk to which the outcome is assigned. Pitfall alert.
Relative versus absolute scoring in attitude to risk questionnaires
How other individuals answer the ATRQ impacts results with relative scoring – only a certain percentage can fall into each outcome set. This could mean that based on answers submitted in other ATRQs, a client could fall into a higher or lower category than expected. It all depends on who else answered the ATRQ.
Absolute scoring, to the contrary, enables the client’s risk profile to be identified independently of other ATRQ responders. It also means that mapping to an asset allocation considers the actual risk characteristic of the client. The risk level doesn’t change over time based on others’ responses, such as the population on average becoming more risk-averse.
In summation, while your client’s answers are the same, with absolute scoring, you will always get the same result, but with relative scoring, the result will skew depending on how others answer. So, the pitfall for advisers is if you are unaware of the underlying scoring methodology, the ground – a.k.a. the definition of risk – could be shifting under your feet.
Asset allocation snags
Whether you decide to adopt suggested asset allocations of the risk profiler itself or use in-house strategic allocations, clearly benchmark asset allocations should be defined for each risk profile/outcome. These benchmarks are used to determine the position on the risk scale against which the asset allocations of the selected funds, or portfolio, can be assessed.
Consider the underlying horizon of your chosen benchmark asset allocations. The investment term is vital when assessing and defining risk and can be a potential pitfall in risk mapping. For example, the return on cash may be little or no variation in the short term but can vary more dramatically over more extended periods. PROD has gone some way to reinforce the importance of terms as part of life-stage segmentation.
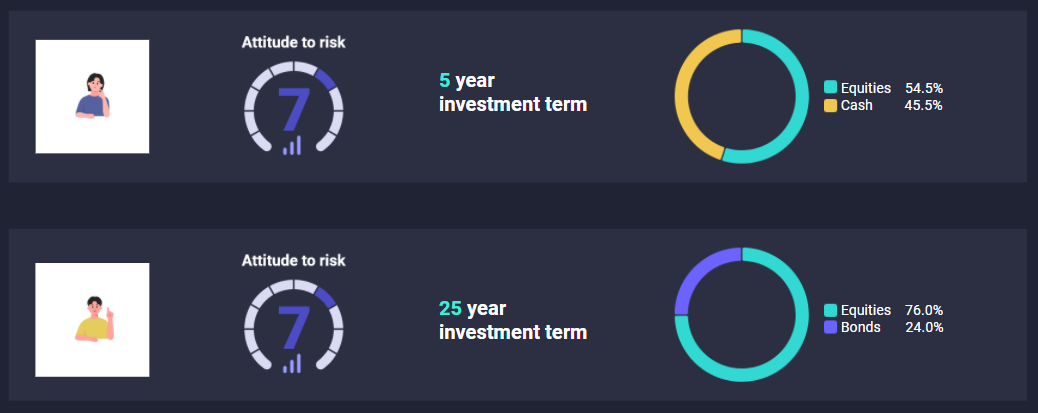
A tangible pitfall in the advice journey can be when justifying allocating a portfolio with higher equity content to a client with a longer investment term than would be indicated by a single-term model.
Risk mapping sand traps
Before we get to risk mapping as a client suitability tool, we need to consider how objectives relate to the risk mapping process.
Investment objectives are best split into two areas:
Growth: identify how comfortable your client is with the volatility of their investment outcomes in accumulation
Income: determine how comfortable your client is with the uncertainty of their income in decumulation.
As each objective is affected by different risks, the pitfall here is not determining if the risk mapping process accommodates income or value at risk.
Investment proposition snares
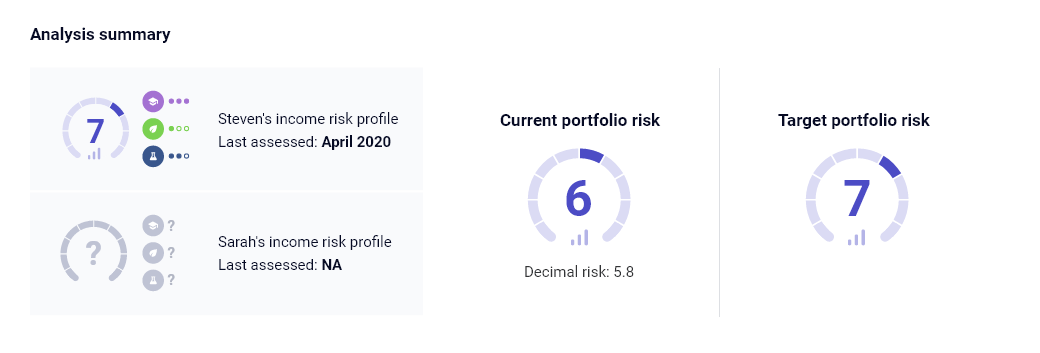
Let’s say the risk profiler determines that investment solutions with a 7 risk score are suitable for a particular client, and a suggested asset allocation is supplied. The question is, how does the portfolio align to this?
The proposition’s level 7 interpretation may be either more or less risky than the above, resulting in unsuitable asset allocations compared to the asset allocation benchmark. The crunch comes if regular portfolio rebalancing, either periodically or reactively, creates risk misalignment over time.
Trying to resolve this by blending funds using satellites or building in-house models requires in-house methodology or manual and time-consuming cross-referencing. Not ideal.
EVPro's risk mapping plots the safe route
Here’s the crux of our solution. Applying EVPro’s stochastic modelling, the returns of 27 asset classes are modelled through 1,000 scenarios over 75 individual years. So let’s say you add a pension, invested in funds:
- We first receive asset allocation data from FE or directly from asset managers
- We convert this into our asset classes
- We then obtain a combined return for that fund and roll it up over the selected term
- We then take the natural log of the 1,000 returns
- We then calculate the standard deviation
- This then provides volatility we can map to the efficient portfolios
Evidence of this is captured, providing an audit trail of suitability. But, again, a live demo will best prove the point, available on request.
Risk mapping: the take-home message for advisers
Unless both the investment proposition and risk-profiling tools are singing from the same hymn sheet, it is increasingly difficult to deliver and maintain effective risk mapping. Ineffective risk mapping has an adverse effect on client suitability. Full stop.
Once you have established your client’s risk profile, the next challenge is to understand and match the most suitable funds to meet your client’s objective. This could be a sustainable amount of income in decumulation or navigating market volatility while still accumulating.
Still, one thing is for sure, no matter what your client objective is, having robust risk-mapping capabilities in your adviser tools will go a long way to demonstrating suitability for your clients.
So what next?
If you found this information helpful and want to see how you can deliver better risk mapping for your clients. Then, why not book your one-to-one demo of EVPro, by clicking the link below.